Monitoring PDPs
The PDP Monitoring page is an Early Access Program (EAP) feature.
Behavior, UI semantics, data retention, and displayed metadata may change between releases.
Overview
The PDP Monitoring page provides real-time visibility into PDP instances registered with the Permit control plane. It is designed for operational awareness, not as a historical audit or incident timeline.
Use the Monitoring page to:
- Track active PDP instances across your environments
- Verify deployment consistency during rollouts
- Identify version mismatches between PDP and OPA
- Monitor connection status of your PDP fleet
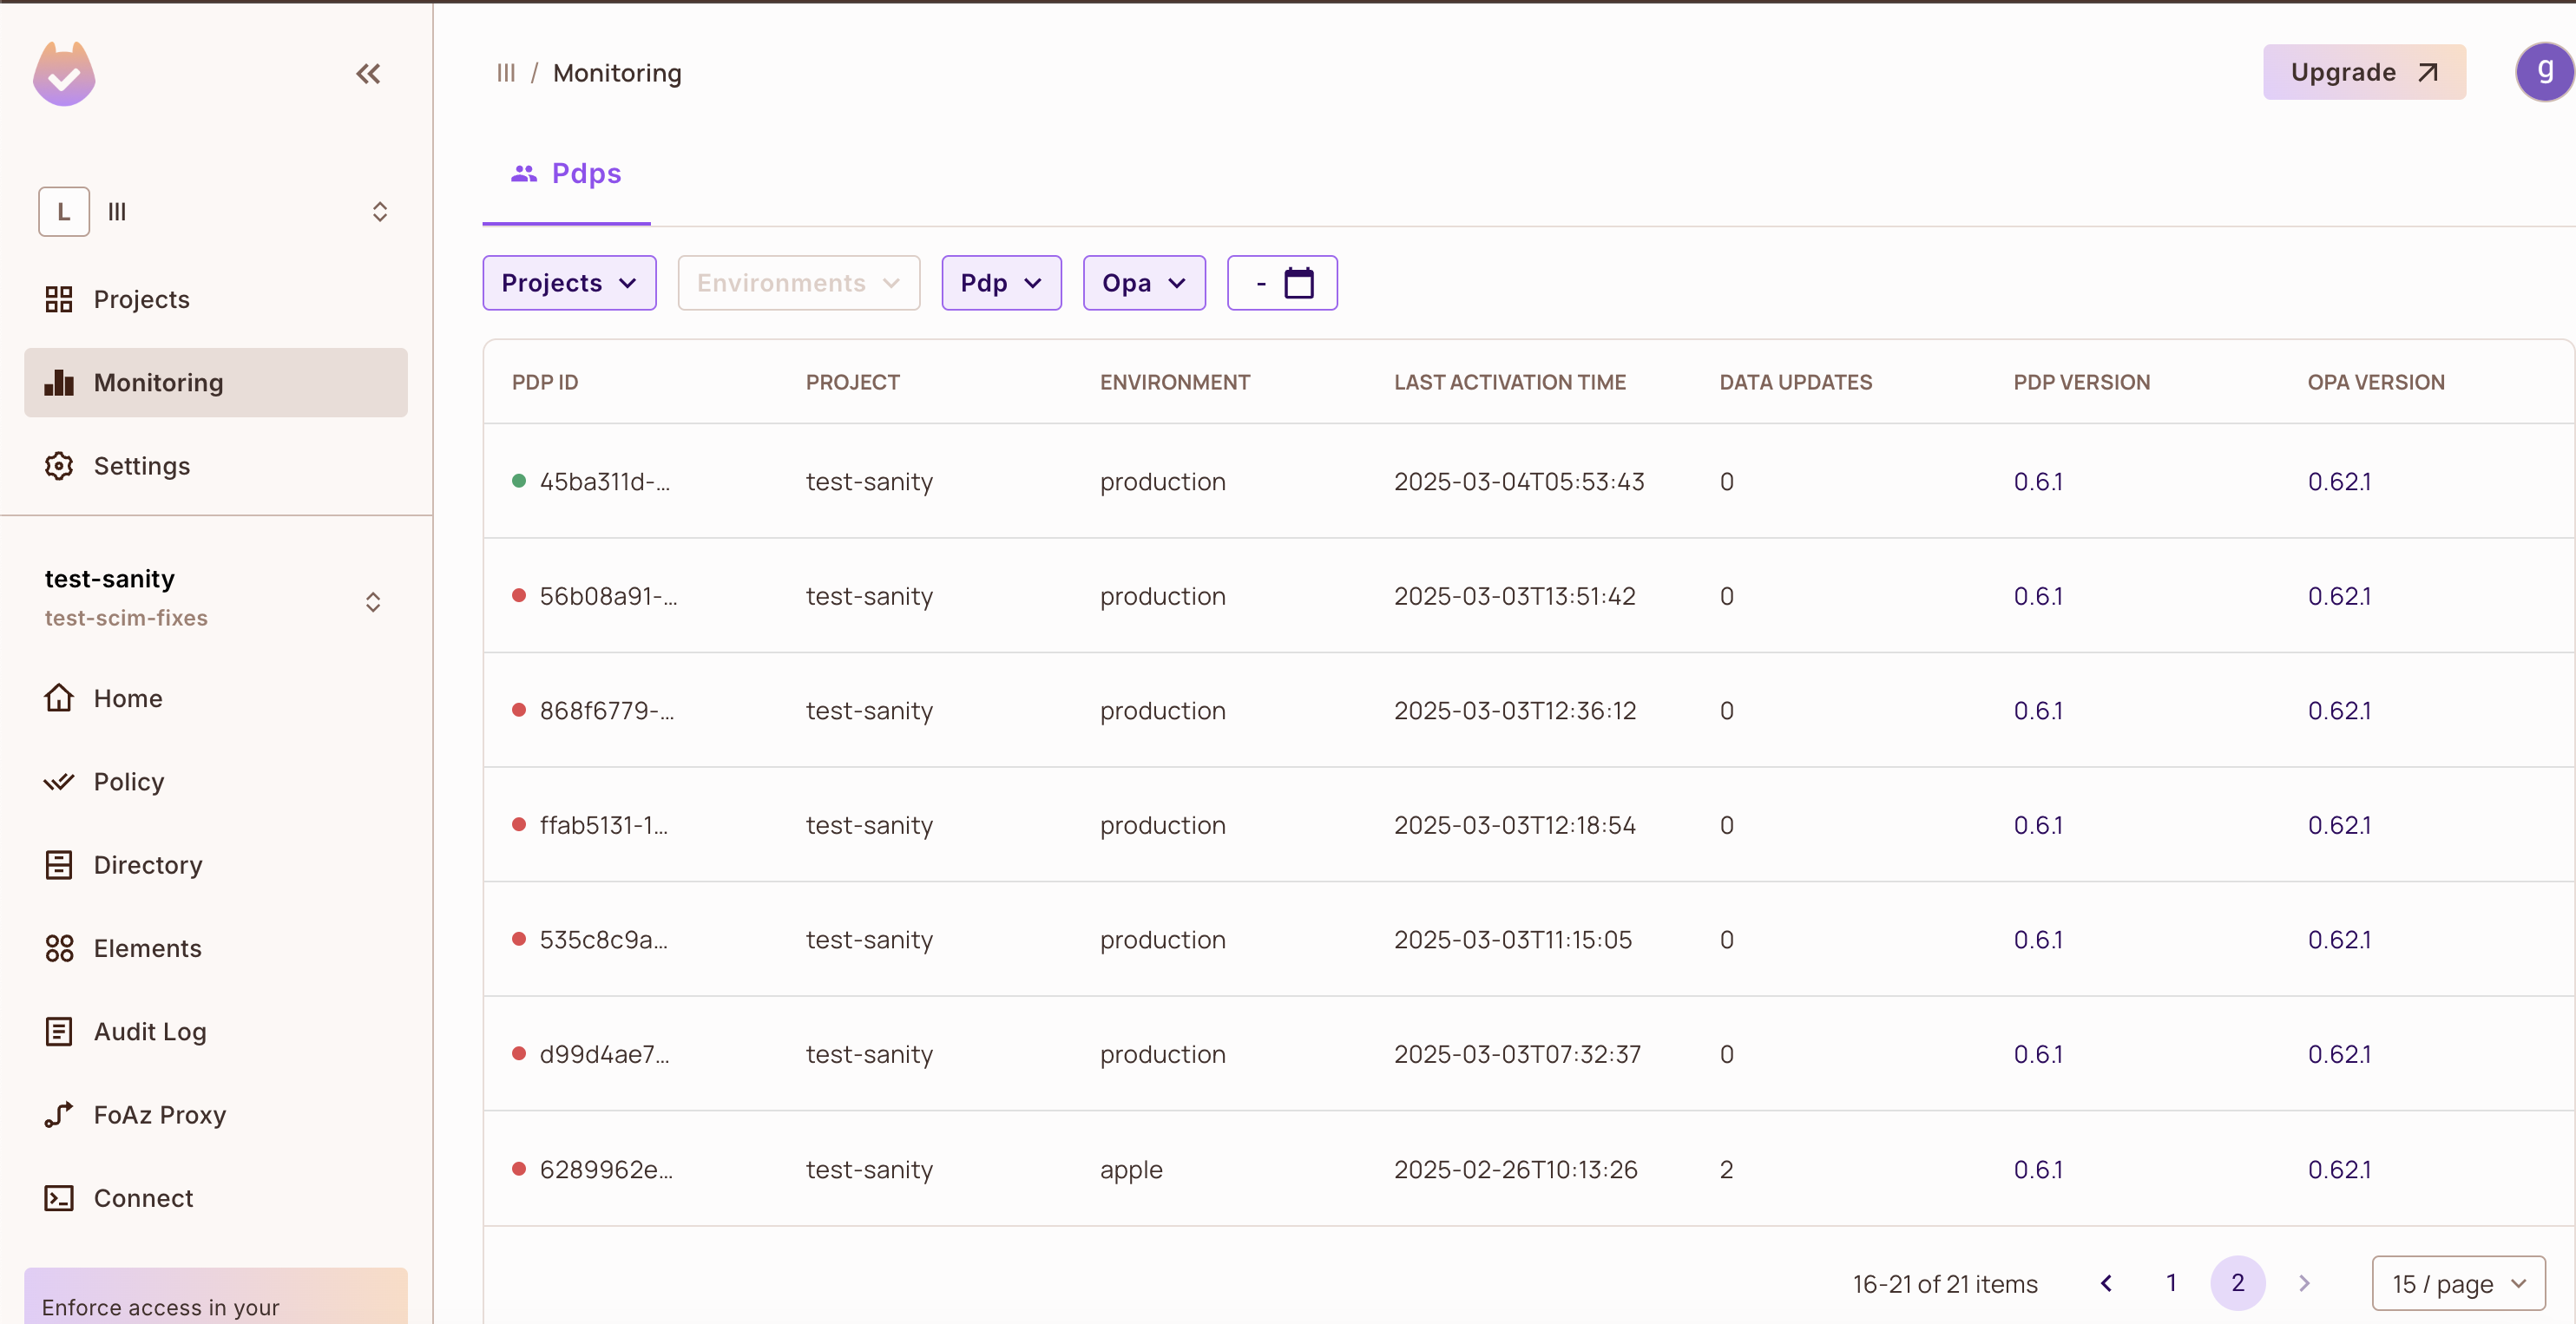
Information Displayed per PDP
For each PDP instance, the Monitoring page displays:
| Information | Description |
|---|---|
| Connection Status | Current connectivity state (connected / not connected) |
| PDP Version | Version of the PDP software running on the instance |
| OPA Version | Version of Open Policy Agent bundled with the PDP |
| Environment | The environment the PDP is connected to |
| Project | Associated project name |
| Last Activation | Most recent activity timestamp |
| Data Updated | Last data update timestamp |
This information helps operators:
- ✅ Verify rollout consistency across deployments
- ✅ Identify outdated PDP or OPA versions that need upgrading
- ✅ Correlate behavior with specific PDP builds during troubleshooting
Understanding Connection Status
Green Status (Connected)
A PDP shown as green indicates the instance is currently connected and actively communicating with the Permit control plane.
Red Status (Not Connected)
A PDP shown as red does not necessarily indicate an active failure or problem.
A PDP may appear red when:
- The PDP process was stopped or terminated
- A container or pod was restarted during deployment
- The PDP instance was decommissioned
- The PDP has not checked in recently
These conditions are expected, especially in environments with:
- Frequent releases and deployments
- Autoscaling that creates and destroys instances
- Rolling updates that restart pods
Most red PDPs observed in production are previously running PDPs that were stopped, not PDPs experiencing live disconnects. This is normal in dynamic environments.
Common Reasons for Many Red PDPs
If you see many red PDPs in your monitoring view, it's often due to:
- High deployment frequency — Frequent releases create new PDP instances while old ones remain visible
- Rolling updates or pod restarts — Kubernetes rolling updates restart pods, leaving previous instances visible
- Short-lived PDP instances — Autoscaling creates temporary instances that appear red after scaling down
- Autoscaling events — Scale-up and scale-down events create and remove PDP instances
Stopped PDPs may remain visible in the monitoring view, which can lead to an accumulation of red PDPs over time. This is expected behavior and does not indicate a problem with your active PDPs.
Health Checks vs. Sync Operations
It's important to distinguish between two different behaviors when monitoring PDPs:
Health Check Status (UI)
The connection status shown in the Monitoring UI:
- Reflects whether a PDP is currently connected to the control plane
- Does not represent historical health check success or failure
- Shows the real-time state at the moment you view the page
Sync / Create Operations (Logs)
When reviewing PDP logs, you may see:
- Read timeouts during consistent update requests
- HTTP 500 errors during sync operations
These log entries do not indicate PDP disconnects or health check failures. They are typically related to client-side timeout configuration and are separate from the connection status shown in the UI.
Timeout Configuration Guidance
PDPs may encounter read timeouts when client-side timeouts are configured too aggressively.
Use the default PDP_CONTROL_PLANE_TIMEOUT (75 seconds) to allow the Permit API to manage request duration properly.
Setting timeouts too low (for example, around 5 seconds) can cause unnecessary timeout errors in logs.
Version Management
The Monitoring page helps you maintain version consistency across your PDP fleet.
Best Practices
- ✅ Always ensure PDP instances are running a recent, supported version
- ✅ Use the Monitoring page to identify outdated PDP or OPA versions during and after rollouts
- ✅ Verify version consistency across environments before completing deployments
Version Information
The Monitoring page displays both:
- PDP Version — The version of the Permit PDP software
- OPA Version — The version of Open Policy Agent bundled with the PDP
This dual version display helps you:
- Identify when PDP instances need upgrading
- Ensure OPA version consistency across your fleet
- Troubleshoot issues related to specific version combinations
Related Documentation
- PDP Statistics API — Programmatic access to PDP monitoring data
- PDP Webhooks — Real-time notifications for PDP events
- PDP Overview — Learn more about Policy Decision Points
- PDP Configuration — Configure PDP settings and timeouts